Example usage
Optimization mode
First, execute test_data.sh script, included in optimalTAD folder:
chmod a+x ./test_data.sh
./test_data.sh
It will create testdata folder containing Hi-C and ChIP-seq profiles of Drosophila chromosome 2L. Next, run optimalTAD as follows:
optimalTAD run
If everything done in a correct way, than you will see something like this in your terminal:
optimalTAD: INFO       Samplename: LacZ1_2L
optimalTAD: INFO       Load Hi-C data
optimalTAD: INFO       Load epigenetic data
numexpr.utils: INFO       NumExpr defaulting to 4 threads.
optimalTAD: INFO       Run armatus on 1 chromosomes:
                      |███████████████████████████████████████████████| 100.0% complete
optimalTAD: INFO       Calculate indexes
optimalTAD: INFO       Calculate amplitudes
optimalTAD: INFO       The optimal gamma for LacZ1_2L is 1.1
optimalTAD: INFO       Done!

optimalTAD: INFO       Execution time: 26.6 sec
This output tells us that the optimal set of TADs is corresponded to gamma = 1.1
Once optimization is done, we can explore the folder named ‘output’ containing all the results along with temporary files generated by optimalTAD. The output directory has a following structure:
├── all_stairs.csv
├── amplitudes.csv
├── data
│       └── LacZ1_2L
│               └── chr2L.txt.gz
├── figures
│       ├── BestStairs.png
│       └── StairAmplitude.png
├── optimal_gamma
│       └── LacZ1_2L
│               └── domains.tad
├── stair.csv
└── tads
    └── LacZ1_2L
        └── chr2L
all_stairs.csv: distributions of the ChIP-seq profile around TAD boundaries for each ‘gamma’ value
stair.csv: distribution of the ChIP-seq profile around TAD boundaries for each ‘gamma’ value
chr2L.txt.gz: contact matrix of the input 2L chromosome, temporary file
domains.tad: TAD set corresponded to optimal ‘gamma’ parameter
tads: multicale TAD sets for each ‘gamma’ predicted by Armatus
Algorithm also generates two figures, BestStairs.png (‘a’ subpanel in the figure below) and StairAmplitude.png (‘b’ subpanel).

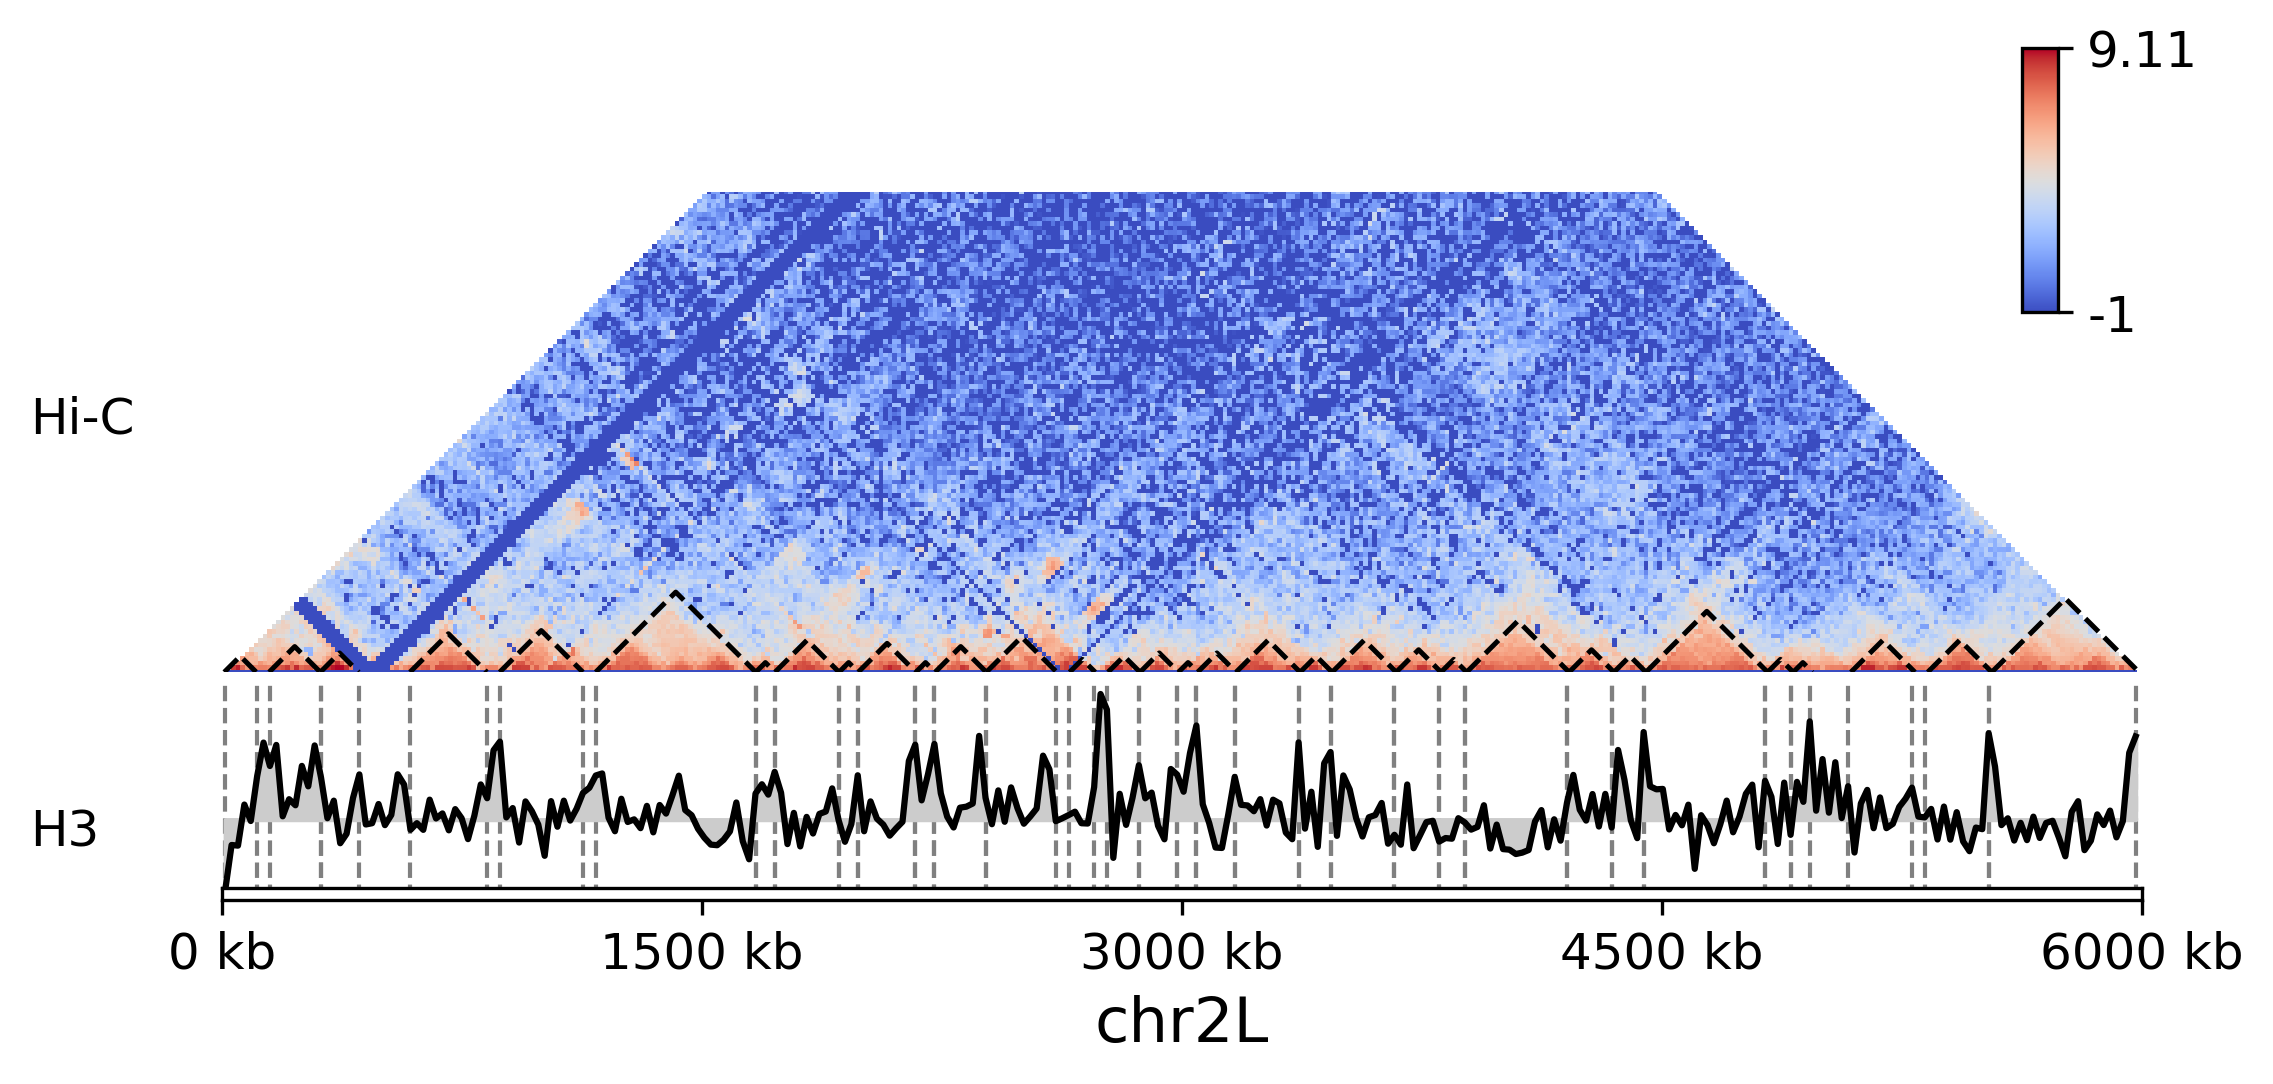
Visualization mode
To plot Hi-C matrix along with optimal TAD set and ChIP-seq profiles, run code below:
optimalTAD visualize